How Mobile Apps Are Transforming E-Commerce in India
India's e-retail GMV hit $65-66 billion in 2025 and UPI cleared 241 billion transactions in FY26. Here's what actually made apps the default storefront.
By Tart Labs·Published
Want to start a Project?
share
share
Written by Gowtham Raj, Director at TartLabs, who leads mobile and custom software engagements for retail, commerce, and enterprise clients.
The Short Answer
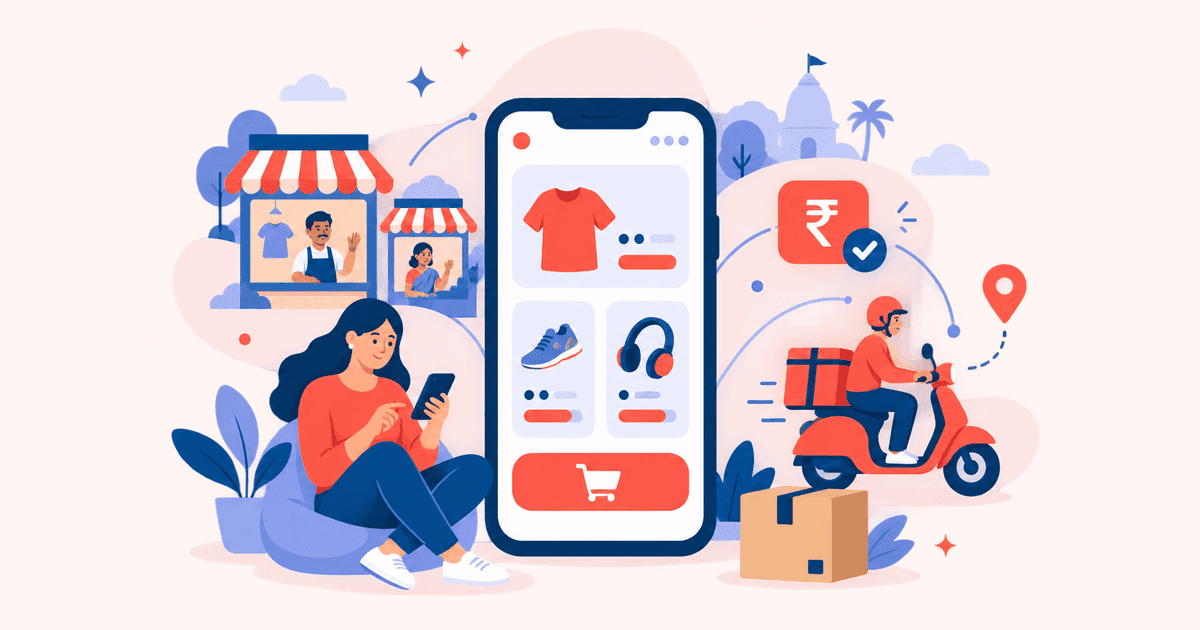
Calling mobile apps a popular way to shop in India undersells what happened. The app became the layer where the whole transaction lives, from first browse through payment to a ten-minute doorstep delivery. It got there by riding four pieces of national infrastructure that landed at roughly the same moment: cheap mobile data, a universal payments rail, a fulfilment network that reaches well past the metros, and a device base wide enough that owning a smartphone stopped signalling affluence."
What follows examines what current data says about that shift, which parts are still gathering speed through 2026, and which parts have started working against builders rather than for them. Founders, retail CTOs, and product leads choosing what to build for India are the intended readers. Anyone still needing convincing that mobile matters here is not.
Key Takeaways
India's e-retail market closed 2025 at $65-66 billion in GMV, growing 19-21%, with the annual online shopper base at 290-300 million (roughly 30% of internet users) and growth accelerating to 23-25% in Q1 2026 (Bain & Company × Flipkart, How India Shops Online 2026, April 2026)
UPI processed 24,161.69 crore transactions (about 241.6 billion) worth ₹314 lakh crore in FY 2025-26, up 30.0% by volume, and now accounts for 85% of India's digital payments and 49% of global real-time payment volume (PIB, Ministry of Finance, April 2026, citing NPCI data)
India generated around 25 billion app downloads in 2025, the highest of any country, with time spent on track to exceed 1.3 trillion hours by 2026 (Sensor Tower, State of India Mobile App Market 2026, February 2026)
Quick commerce reached $10-11 billion GMV in 2025, 16-17% of all e-retail, and Bain projects it will drive 45-50% of incremental e-retail GMV by 2030 — a category that only exists because the app is the store
The counter-signal: India's smartphone shipments fell 11.1% year over year in Q2 2026 and the sub-$100 segment collapsed 74.3%, shrinking from 15.6% to 4.5% of the market as memory costs pushed average selling prices to a record $315 (IDC, August 2026)
How Big Is India's App-Driven Commerce Market, Really?
Two credible figures get quoted for this market, and they count different things. Separating them first prevents either one being used to argue something it does not support.
Frequently Asked Questions (FAQ)
Because mobile was the only connection most Indian shoppers ever had. TRAI's July 2026 data shows 1,046.34 million wireless broadband subscribers against 48.14 million wireline ones. Indian commerce platforms never had a desktop base to migrate from, so they built app-first, and the UPI payments rail then removed the checkout friction that had limited conversion on every other channel.
Let's connect and create something amazing together!
Got an idea or project in mind? Whether it's custom software, a dedicated dev team, or help with digital transformation, we're here for it. Reach out—we'll bring your vision to life.
Thinking through a new idea or stuck with a challenge? Drop us a message—we'll listen, brainstorm, and help move things forward.
Bain & Company, in partnership with Flipkart, places India's e-retail GMV at $65-66 billion for calendar 2025, a rise of 19-21% in value terms, with Q1 2026 reaccelerating to 23-25% (How India Shops Online 2026, published April 8, 2026). What that number counts is goods sold online: physical merchandise moving through marketplaces, D2C brands, and quick commerce.
GlobalData takes in the wider e-commerce market, travel, ticketing and services included, and arrives at ₹17.5 trillion ($200.9 billion) for 2025 with a 2026 forecast of ₹19.7 trillion ($225.9 billion), up 12.4% (GlobalData press release, February 26, 2026).
Both are correct within their own scope. For anyone building a shopping app, the retail figure is the one that matters, since that is the pool the app competes in. Bain expects it to reach $170-180 billion by 2030 at better than 20% CAGR, which would push online past one in every ten retail rupees spent in India.
Turning to apps themselves: India produced roughly 25 billion downloads across 2025, ahead of every other country, and cumulative time spent is tracking toward 1.3 trillion hours in 2026 (Sensor Tower, State of India Mobile App Market 2026, February 2026). Installs in Q2 2026 alone came to 6.6 billion, the strongest quarter since January 2024 (Sensor Tower, India Q2 2026, July 2026).
Our take: Of everything here, the scale numbers reveal the least. India has topped the global download charts for years. The real change between 2020 and 2026 is not install volume but how much of an end-to-end commercial transaction now completes without the user ever leaving the app. That shift was delivered by payments and logistics infrastructure, not by better app design.
The Four Shifts That Made the App the Default Storefront
1. Mobile Became the Only Connection Most Indians Have
At the close of July 2026, India counted 1,046.34 million wireless broadband subscribers with machine-to-machine connections included, or 957.58 million once they are stripped out, against 48.14 million wireline broadband subscribers (TRAI Press Release No. 116/2026, August 28, 2026). Read the ratio rather than the totals: of roughly twenty Indians online, nineteen got there over a mobile network.
That describes something different from a "mobile-first" market in the marketing sense. Desktop e-commerce here never built a base large enough to lose. Indian commerce platforms consequently skipped the responsive-website-then-app sequence Western retailers worked through, and were app-first from day one.
The same TRAI release records rural tele-density at 61.05% and urban tele-density at 154.12%, a reminder that those headline connection totals sit very unevenly across the country. Most of the growth still available to Indian e-commerce lives inside that gap.
2. UPI Removed the Checkout Step
Before 2019, nothing held Indian e-commerce back structurally more than payment friction. That drag has effectively disappeared. FY 2025-26 saw UPI clear 24,161.69 crore transactions, roughly 241.6 billion, worth approximately ₹314 lakh crore, with volume up 30.0% and value up 20.59% year over year across 703 live banks (Press Information Bureau, Ministry of Finance, April 30, 2026, citing NPCI figures). UPI today carries 85% of India's digital payments and 49% of global real-time payment volume.
Buried below that headline are two details that matter more to anyone building a commerce app. Person-to-merchant payments account for 63% of UPI volume, and 86% of those P2M payments fall under ₹500. India's rail is tuned for small, frequent, low-friction purchases. That happens to be the exact transaction shape quick commerce and social commerce run on, and the one card-based checkout has always handled worst.
For product teams, the practical consequence is that "reduce cart abandonment at checkout" pulls far less weight in India than in markets still routing shoppers through card forms and 3D Secure. Friction did not vanish so much as relocate, to discovery, to trust, and to returns.
3. Growth Moved Past the Metros
Bain attributes roughly half of all incremental e-retail orders in 2025 to Tier-2 and smaller towns. Gen Z made up 40-45% of shoppers and close to half of incremental orders, while middle-income households supplied about 50% of new shoppers.
App-level data reaches the same conclusion by a different route. Meesho took the most-downloaded shopping app slot in India for Q2 2026, and close to 46% of its monthly active users came from markets outside the country's top nine cities (Sensor Tower, India Q2 2026, July 2026). Across several leading beauty and fashion platforms, Sensor Tower found regional users now make up over a third of total active users, with new demand centres surfacing in cities such as Kochi, Kozhikode, and Patna.
Apps designed around metro assumptions tend to break here first. Someone shopping from a Tier-3 town is likelier to be on an entry-level Android handset, on an intermittent connection, reading in a language other than English, and spending less per order. An app that feels fine on a flagship in Bengaluru and painful on a three-year-old budget phone in Patna has written off half the market's growth.
Our take: Across our own commerce engagements, what most often separates a launch build from a production-ready one is not an absent feature but an untested device floor. A team specifies iOS and Android support, then validates on whatever handsets happen to be on people's desks. Naming an explicit minimum device and minimum network target during scoping, and holding every build to it, surfaces more real-world failures than any volume of late-stage QA.
4. Quick Commerce Turned the App Into the Store
Having doubled in each of two consecutive years, quick commerce hit $10-11 billion GMV in 2025, or 16-17% of India's total e-retail, on the back of more than 7,000 micro-fulfilment centres spread across 200-plus cities (Bain × Flipkart, April 2026). Bain's projection has the category at $65-70 billion by 2030, supplying 45-50% of all incremental e-retail GMV.
No business model demonstrates app dependency more plainly. Promising delivery in ten minutes requires real-time location, push notifications, live order tracking, and instant payment confirmation all working in concert. A mobile-web version of that product does not exist, and a desktop version is not even conceivable. Here the app is not a channel serving the business. It is the business.
Coverage of this subject usually ends with the growth numbers. Two current signals point the opposite way, and both are worth designing around rather than waving off.
The cheap smartphone is disappearing. India's smartphone shipments fell 11.1% year over year in Q2 2026 to 33.2 million units, taking the first half of 2026 to 64.2 million units, down 7.9%. Average selling prices climbed 14.4% to a record $315 as a global memory chip shortage pushed component costs up. The damage concentrated at the bottom: shipments under $100 fell 74.3% year over year, and that segment's market share collapsed from 15.6% to 4.5%. IDC expects shipments to fall by more than 15% in the second half of 2026, ending the year at roughly 128-130 million units (IDC India smartphone market data for Q2 2026, released August 11, 2026, as reported by TelecomLead and Free Press Journal).
The entry-level handset was the on-ramp for precisely the Tier-2-and-beyond shopper responsible for half of incremental orders, which is why this matters. With fewer cheap new phones reaching the market, a larger share of the next cohort arrives on older, slower, lower-memory hardware and keeps it longer. Under those conditions, app bloat carries a genuine business cost.
Buying an install has become easier than keeping one. AppsFlyer's State of Marketing in APAC 2026 drew on 30 billion installs across nearly 12,000 apps and $6.7 billion of acquisition and remarketing spend between July 2024 and June 2026. Day-30 retention fell in every combination the study measured: all four verticals, all four sub-regions including the Indian Subcontinent, and both major platforms (AppsFlyer, reported August 27-28, 2026). Download volume is not what constrains growth in India. Holding onto someone past week four is.
Taken together, both signals push the same way. Growth from new devices and from new installs is tightening simultaneously, which moves the return on an app investment away from acquisition and toward performance, retention, and repeat frequency on hardware someone already owns.
What This Means If You're Building for India
Four decisions carry outsized weight in this market, and none of them is what usually dominates a kickoff meeting.
Budget for the device you will actually run on. Set your performance floor against a mid-tier Android phone from three years ago, not against the test devices on the team's desks. Install size, cold-start time, and memory footprint are commercial metrics in a market where the entry-level segment just lost two-thirds of its volume.
Design for intermittent connectivity, not for offline. Full offline mode is usually over-engineering; graceful degradation is not. Cached catalogue browsing, resilient cart state, and retry-safe order submission cover the realistic failure modes on a mobile network outside a metro.
Treat UPI as the default path, not one option among several. With 86% of merchant UPI payments under ₹500 and 63% of all UPI volume going to merchants, checkout should be built around the intent flow first and card entry second, rather than treating UPI as an alternative payment method bolted onto a card-shaped form.
Instrument retention from day one. Given the region-wide Day-30 decline, the metric that determines whether an app pays back is repeat purchase frequency in months two through six. That requires event instrumentation and cohort reporting at launch, not retrofitted after the first quarter of disappointing numbers.
For teams weighing a native build against a lighter-weight alternative, TartLabs' comparison of custom and generic software development works through the tradeoff in more detail, and our custom software development practice scopes exactly this kind of decision before committing to a platform. Where the constraint is delivery capacity rather than direction, dedicated development teams in India can carry the build, and the traffic patterns quick commerce creates usually push the backend toward a cloud-native architecture from the start rather than as a later migration.
The Bottom Line
What transformed Indian e-commerce was not that apps offered a better interface. It was that the app turned out to be where four separate pieces of infrastructure converged: a connection base that is mobile-only, a payments rail built for small merchant transactions, a fulfilment network reaching beyond the metros, and a device base broad enough to make all of it addressable. That convergence produced a market growing 19-21% a year, plus a category in quick commerce with no non-app equivalent anywhere in its stack.
The phase ahead will not resemble the one behind. Installs remain plentiful while retention slides; handsets cost more and stay in use longer. Winning the back half of this decade in India will fall to apps that run fast on modest hardware, stay forgiving on unreliable networks, and are built around repeat purchase instead of first install.
To scope what that looks like for your specific category and customer base, contact TartLabs.